Godot DataViz UI Kit
Godot DataViz UI Kit
Production-ready charts, KPI tiles, graphs, and data grids that plug directly into Godot dashboards. Every control ships with theme-aware styles, integration tips, and runnable GDScript snippets.
Pick a control to start building
Use the categorized gallery below to jump straight into component docs. Each card links to detailed usage guidance, editable code, and theme recommendations so you can compose dashboards without pixel pushing.
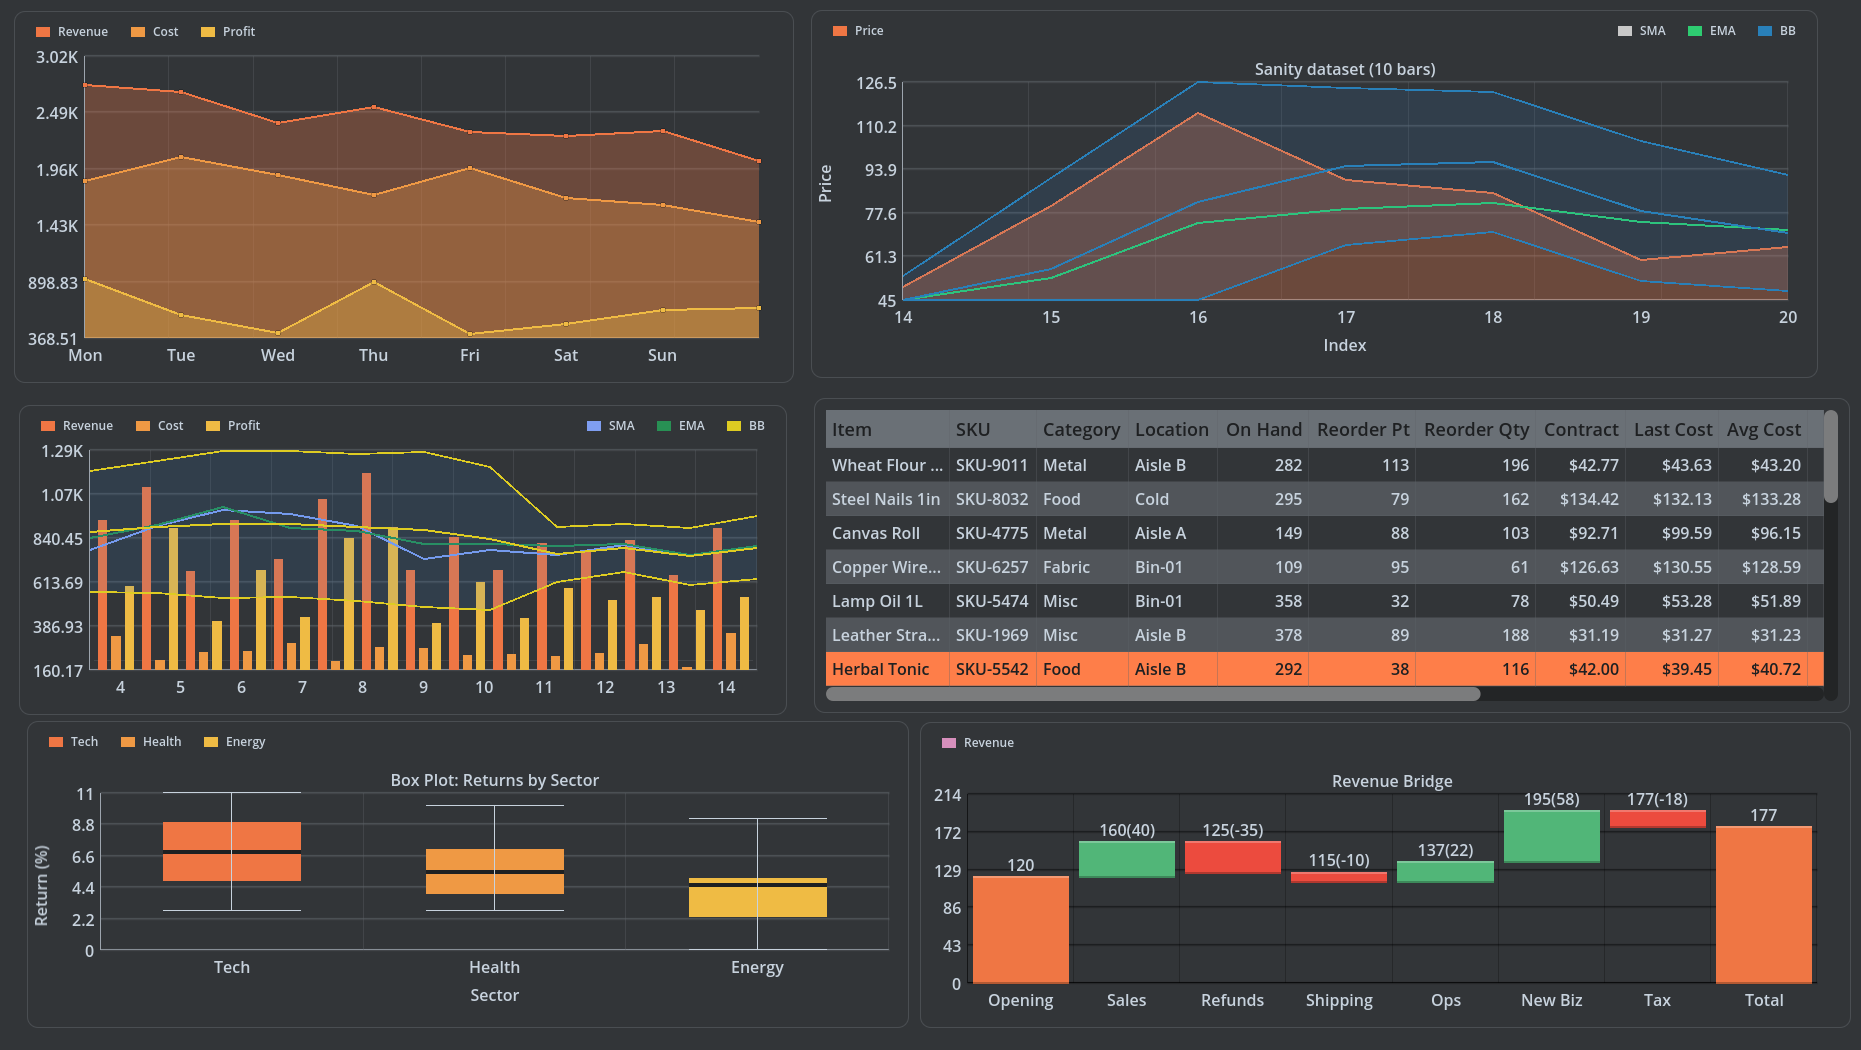
Charts
Plot timelines, quartiles, and categorical breakdowns with responsive chart controls.
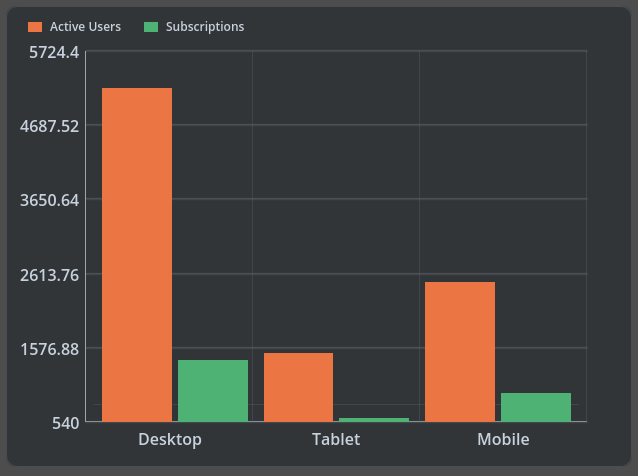
Bar Chart
Fast categorical chart with legends, value labels, and hover/click signals.
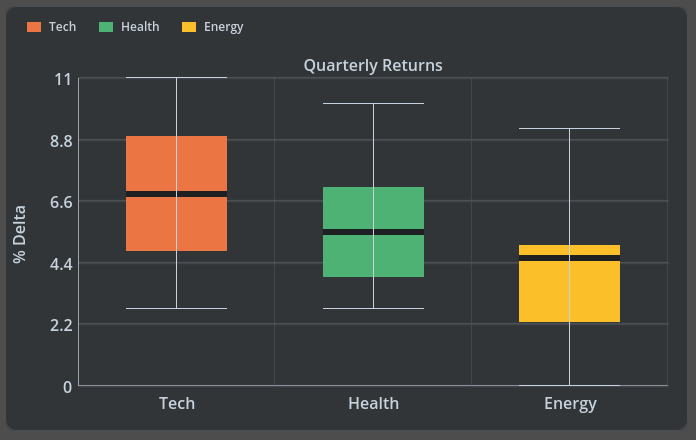
Box Plot
Visualize spread and skew with automatic quartile computation and optional outlier dots.
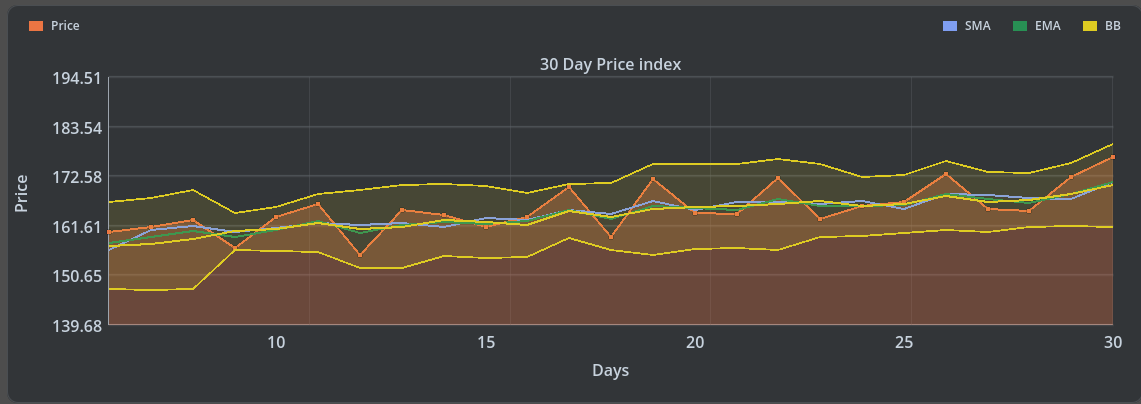
Line Chart
Step lines, optional area fills, and segment hover/selection.
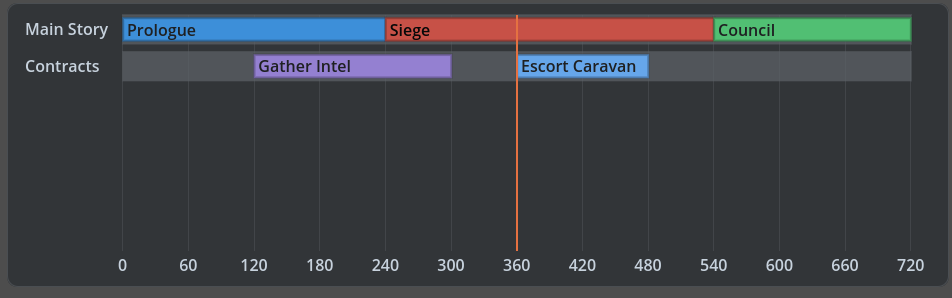
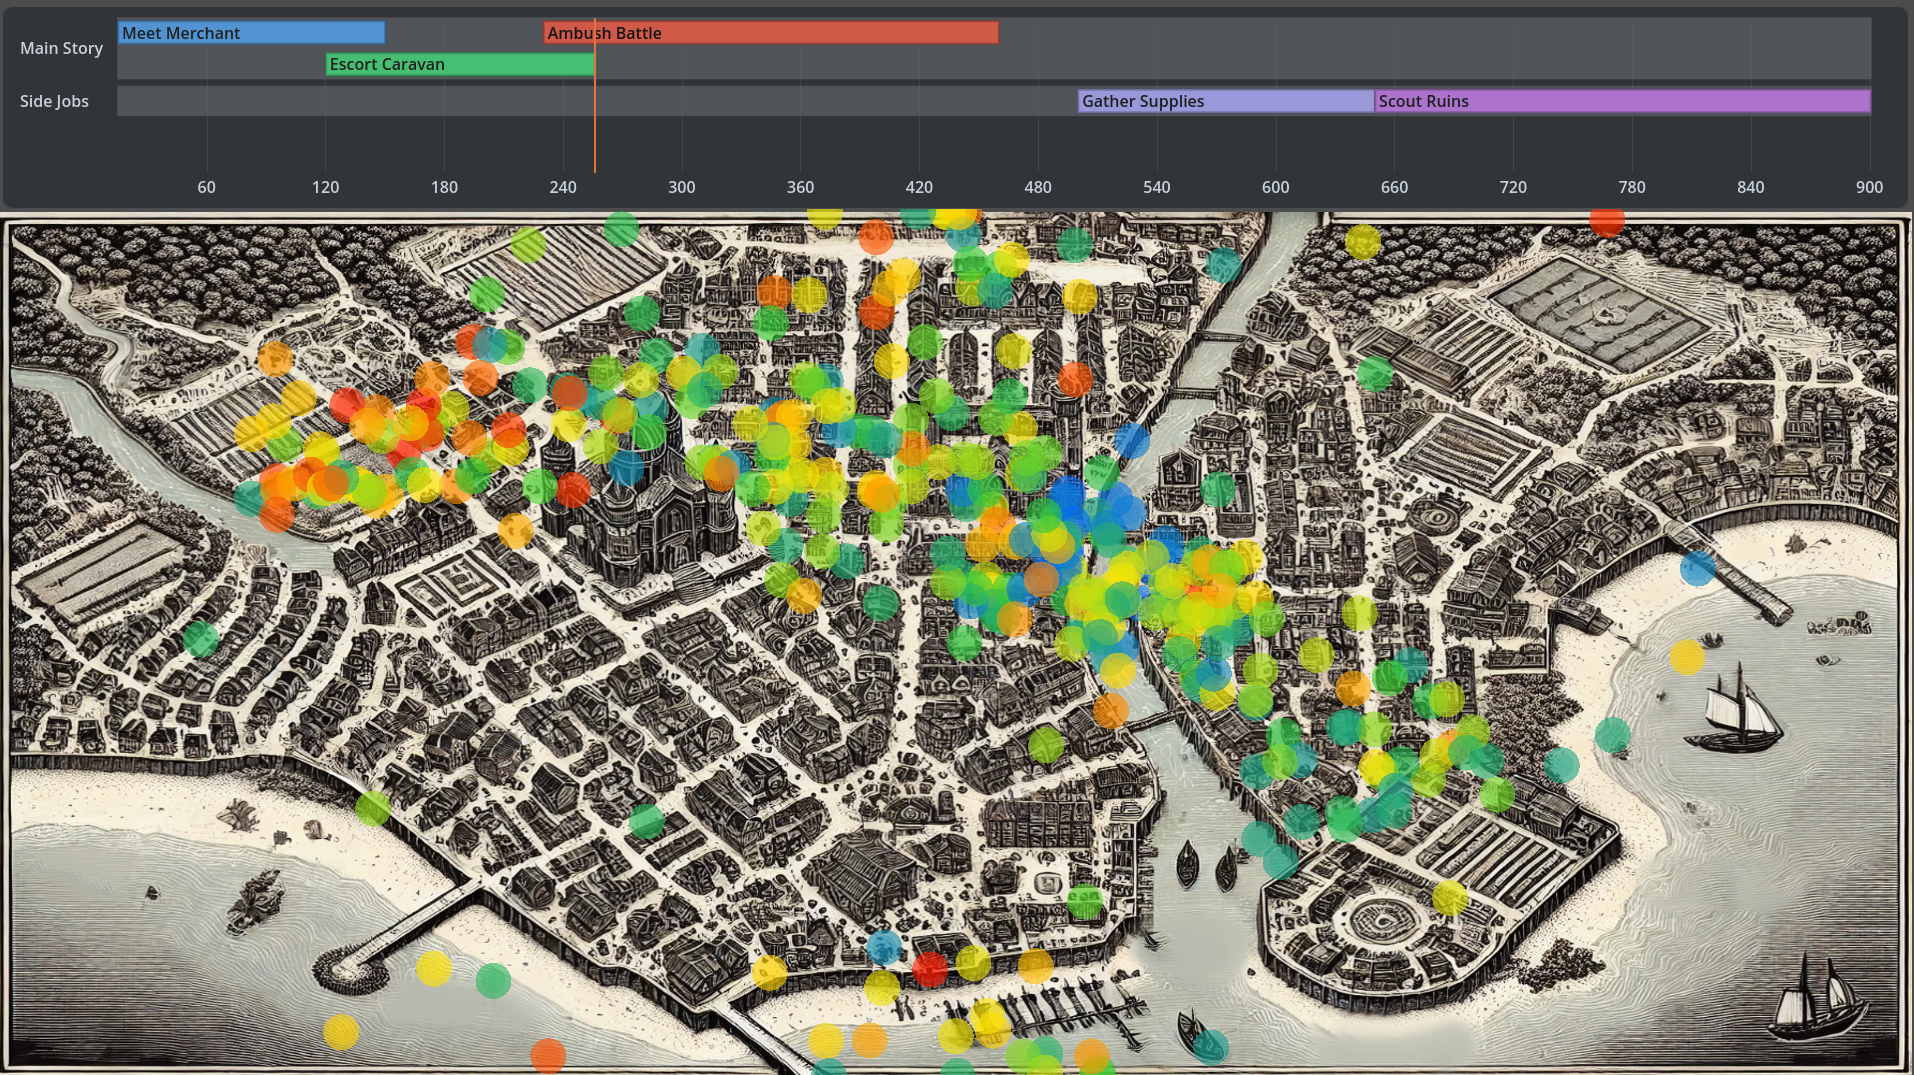
Timeline
Multi-track time blocks for incidents, quests, or production schedules.
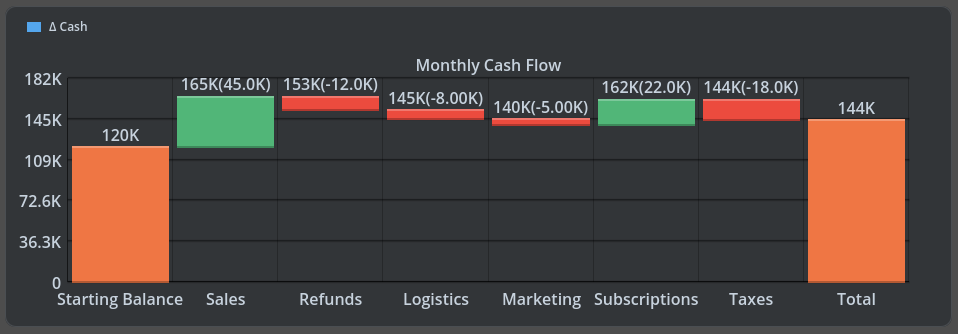
Waterfall
Shows how individual positives/negatives accumulate from start to finish.
Graphs
Surface KPIs, gauges, and comparative radar plots for at-a-glance insights.
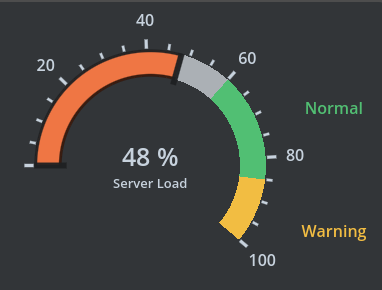
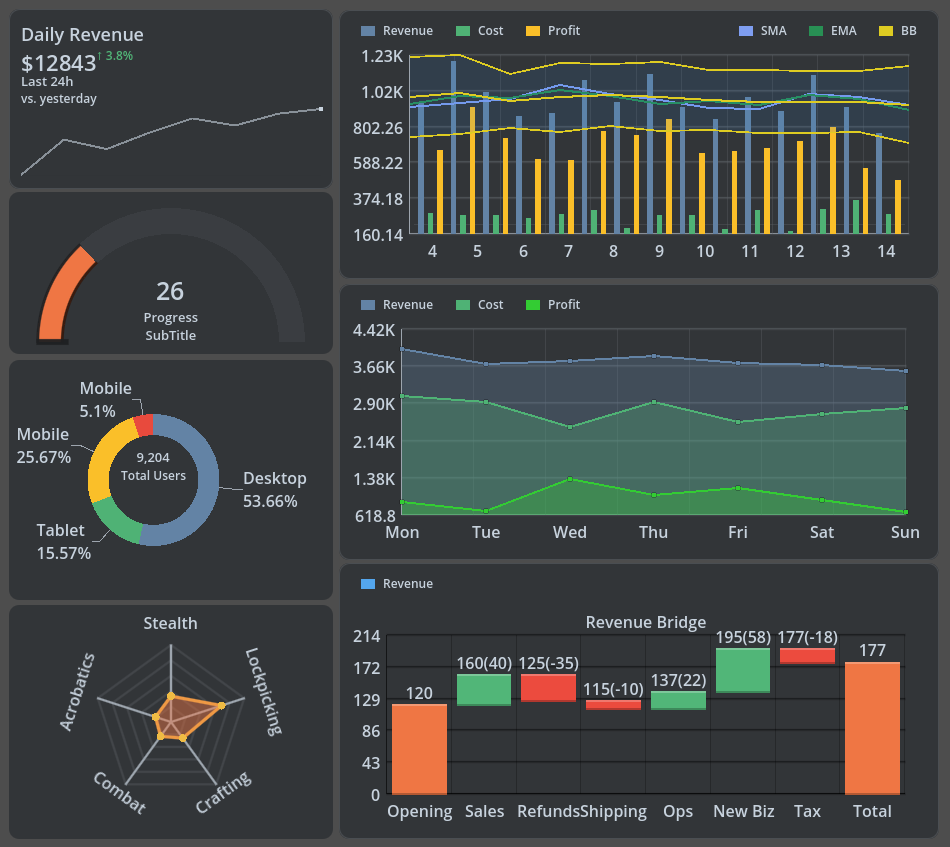
Gauge
Configurable sweep, round/square caps, and dynamic center label.
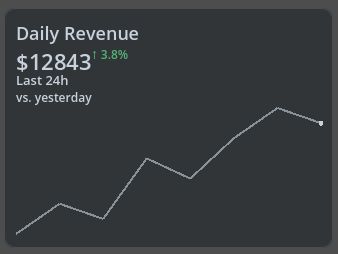
KPI Tile
Compact metric tile for quick-glance stats; supports icons and trend line.
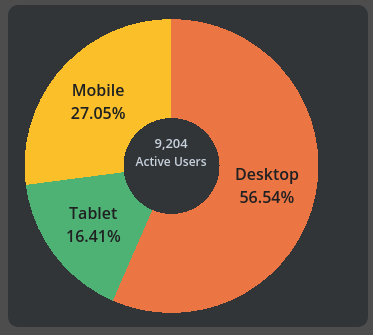
Pie / Donut
Pie chart with leader lines and total-in-center option. And animated hover slices.
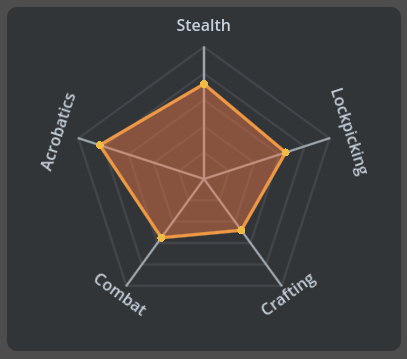
Radar Graph
Plot actor or faction profiles across multiple axes with fill and outline.
Other
Data grids and detail panels for drilling into the numbers behind your dashboards.
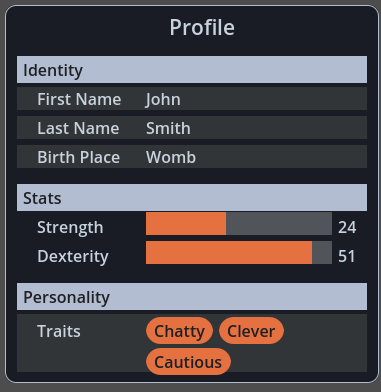
Detail Panel
Flexible facts panel with icons, tooltips, and pill-style tag lists.
Heat Map
Render weighted grids for AI costs, supply/demand, or correlation matrices.
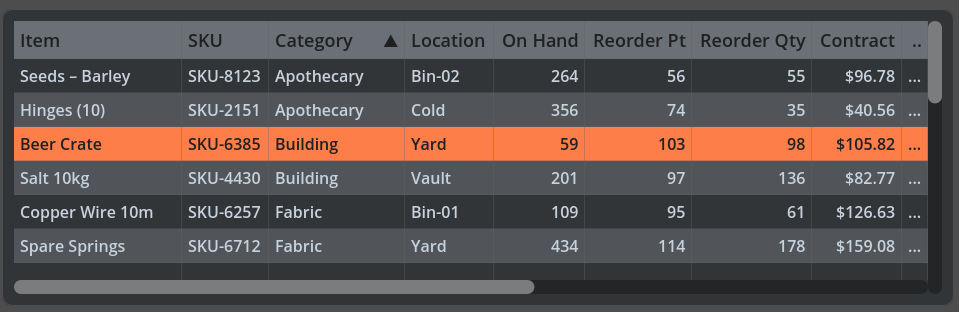
Table Grid
Fast scrolling table with column config, sorting, and selection.
Theme
Configure global palettes, typography, and dark/light modes before wiring controls.
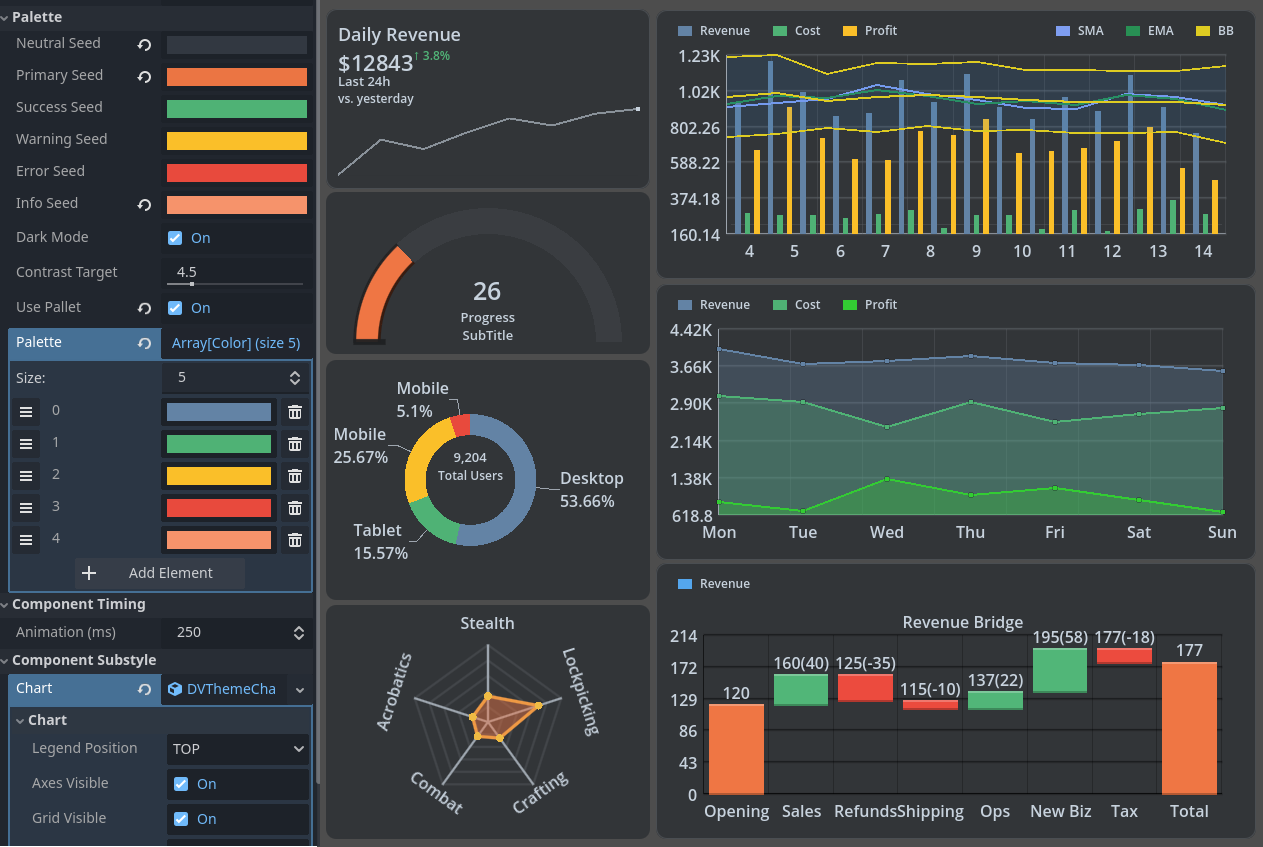
Central Theme Manager
Single source of truth for palette, typography, and component styling. Change a few seeds—everything updates.
Need theme guidance? Start with the Central Theme Manager to configure color seeds and light/dark modes for the entire toolkit.