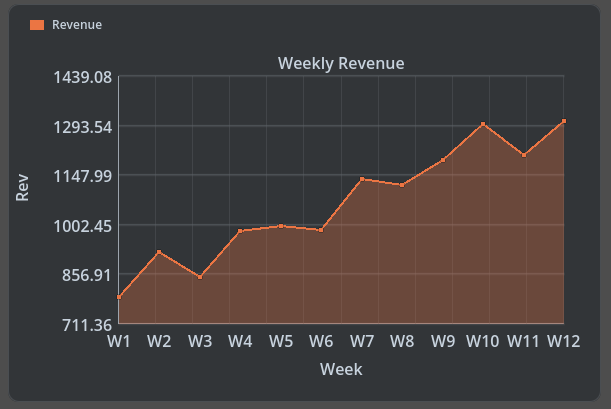
Track metrics across time with smooth or stepped lines, optional area fills, and per-point interactions.

Step lines, optional area fills, and segment hover/selection.
Open Component Docs
Tutorials
Simple Example
Here is how easy it is to get a line grid going, and fill the active line.
Add SMA/EMA Overlays
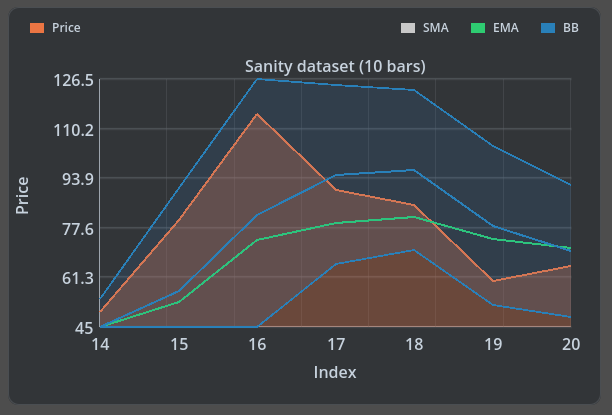
Overlays (SMA, EMA, Bollinger Bands) are enabled per series using an overlay mask that combines OverlayMask flags. Windows are expressed in samples (bars). You can either configure them after adding a series, or use the convenience method that sets everything in one call.


