Overlays
Any chart series can carry analytical overlays. You give the chart a mask and the window lengths; it computes the values, styles them separately from the series, and clips them to whatever range the chart is showing.
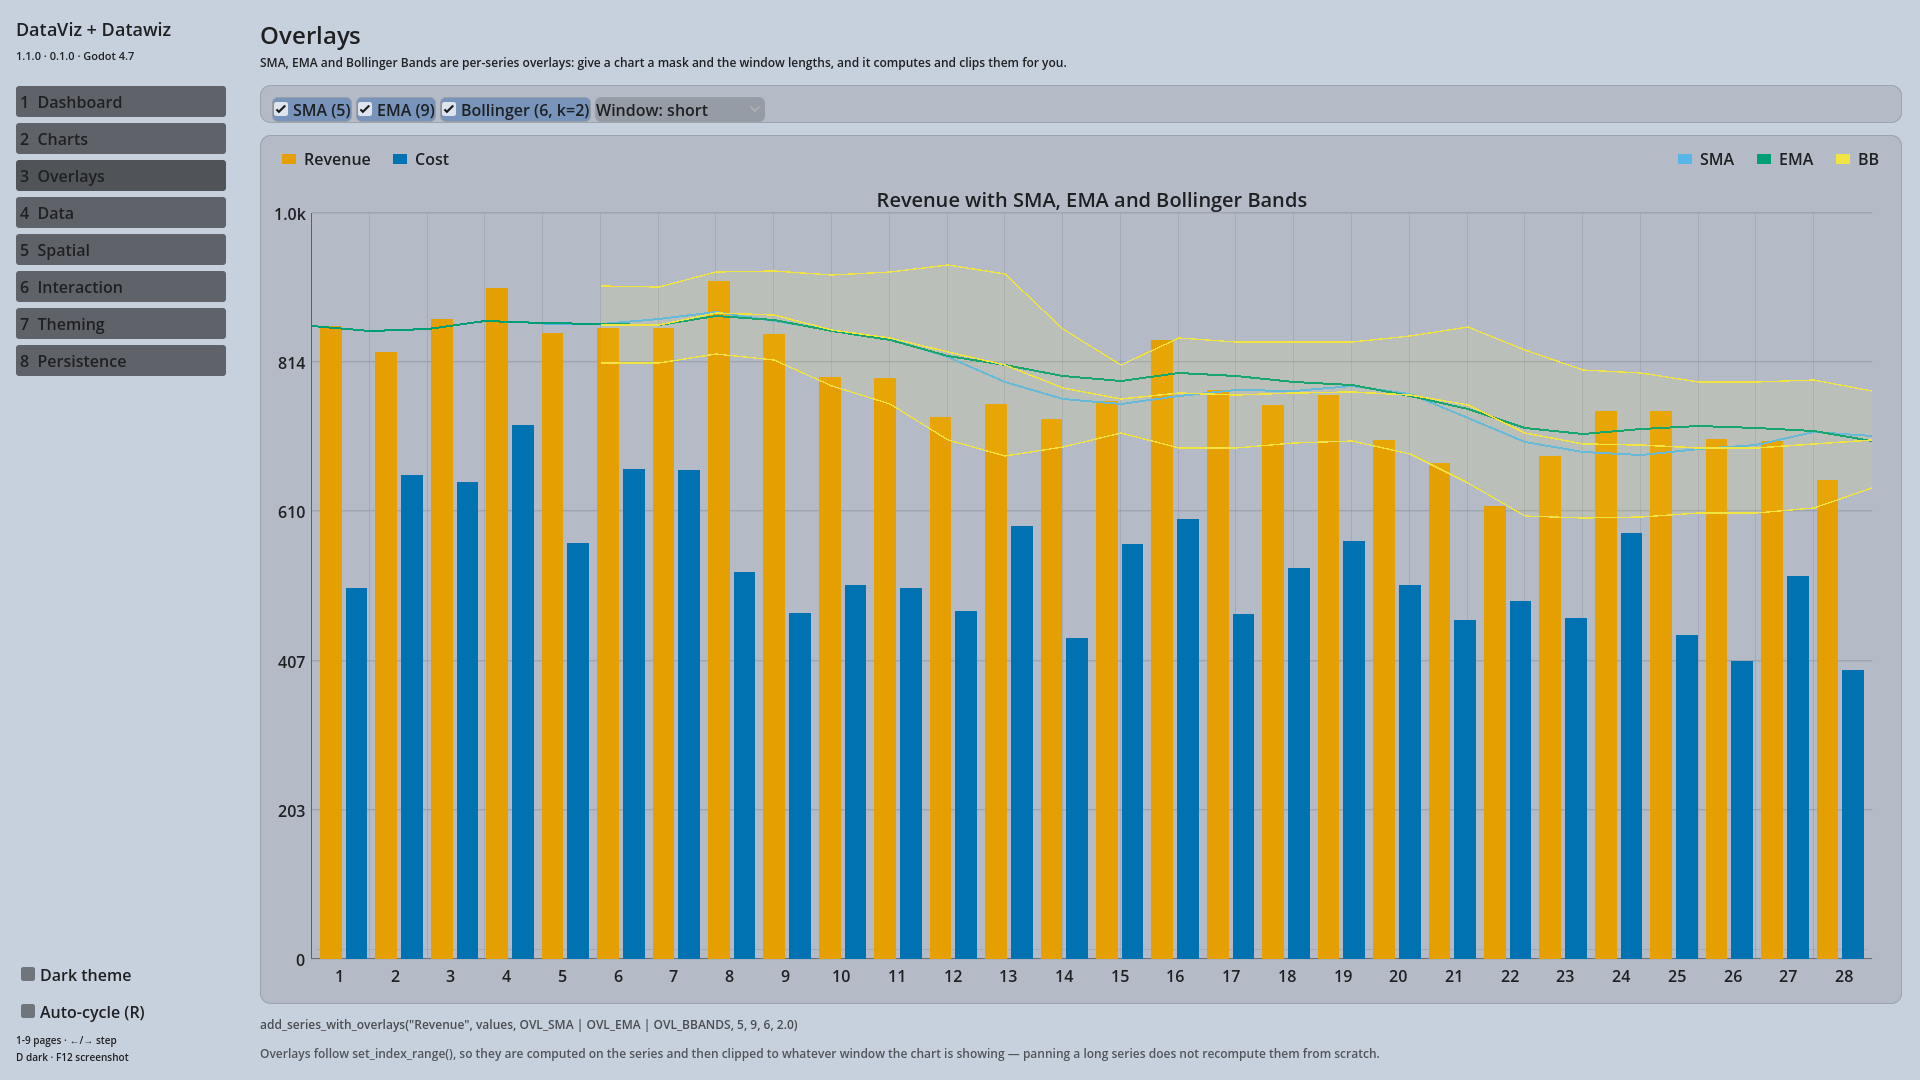
Adding them with the series
var mask := DVChart.OVL_SMA | DVChart.OVL_EMA | DVChart.OVL_BBANDS
var idx := chart.add_series_with_overlays("Revenue", values, mask, 5, 9, 6, 2.0)
#                                          name      values  mask  sma ema bb  k
Or afterwards
var idx := chart.add_series("Revenue", values)
chart.set_series_overlays(idx, DVChart.OVL_SMA | DVChart.OVL_EMA)
chart.set_series_sma_window(idx, 5)      # simple moving average, 5 samples
chart.set_series_ema_window(idx, 9)      # exponential, alpha = 2 / (w + 1)
chart.set_series_bbands_params(idx, 6, 2.0)   # window, k standard deviations
Styling
Overlays are drawn in their own colours so they read against the series:
chart.set_series_sma_style(idx, Color(0.34, 0.71, 0.91), 2.0)
chart.set_series_ema_style(idx, Color(0.0, 0.62, 0.45), 2.0)
chart.set_series_bbands_style(idx,
	Color(0.94, 0.89, 0.26),          # band lines
	Color(0.94, 0.89, 0.26, 0.10),    # fill between them
	1.5)                              # line width
Notes
- The mask is a bitwise OR of
OVL_SMA,OVL_EMAandOVL_BBANDS; pass0to turn every overlay off for that series. - Windows are in samples, not pixels.
- Overlays honour
set_index_range(): they are computed on the series and then clipped to the visible window, so panning a long series does not recompute them. - Each series has its own overlays — you can put bands on revenue and leave cost bare.